

Economic Watch – June 2018
Key Economic Indicators
We monitor indicators to reveal real trends in the economy that have significant impact on the working class and all of us who are not in the 1 %. Then, we propose progressive policies to change the course of the economic trend.
Note: All data is hard data unless otherwise noted as survey or soft data, sources are noted, dated. Please right click on charts to enlarge them in a separate tab.
Economic Status of Working Class
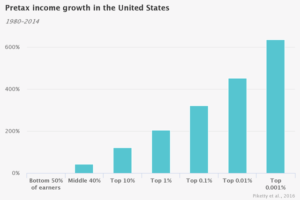
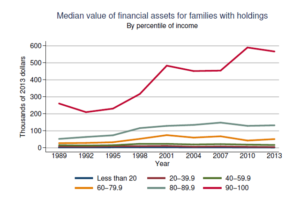
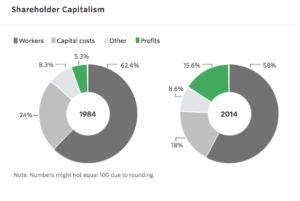
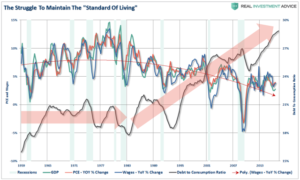
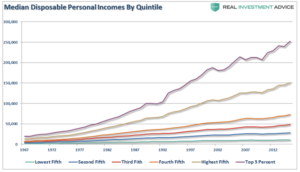
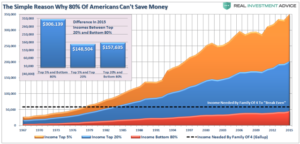
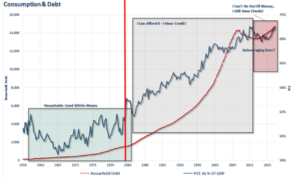
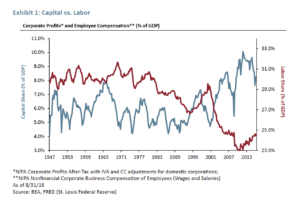
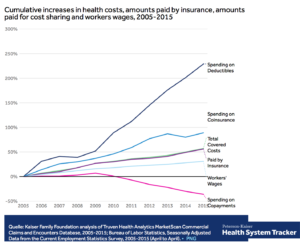
Indicators need to be viewed within an economic framework which is largely hidden by the mainstream financial media. The working class has experienced basically stagnant pre – tax income growth since 1980 until the present day, and the top 10 % continues to increase their income at a 90 % rate over people in the working class income ranges for the same period. Total income including bonuses held up until 2000 recession then declining considerably in the last 15 years as a percent of GDP. Profits since 1984 have grown by 3 times while dollars spent on worker wages and benefits has actually decreased by 4 %. Profits drive stock valuations up so executives make much more through stock buy backs and salary compensation based on stock price and profit targets. It seems clear that capital spent to automate company processes has hurt the position of workers in the corporate funding pie. Increased productivity has not translated into increased wages for workers, but increased salaries for executives. For middle class workers dependent on only wage income has fallen quickly since 1974. Aggregate household income continues to fall with lower peaks since 1997 – since the Great Recession household income (all workers in the home) has been stagnant. Workers have been borrowing money at an increasing rate to maintain their standard of living. The percentage of debt to consumption is at the highest level it has ever been – increasing dramatically since 1995 when wage growth began stagnating. The gap between standard of living and income factors has only accelerated in the past 7 years since the Great Recession – this condition is unsustainable and likely to end with a deleveraging event.
Sources: Piketty 2016, Real Investment Advice – 6/20/17
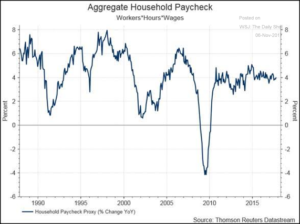
Sources: Thomson Reuters Datastream, The Wall Street Journal, The Daily Shot – 11/6/17

Source: Federal Reserve Bank – St. Louis – 2014
Source: The Federal Reserve – 2104, Real Investment Advice – 6/20/17
Source: The Wall Street Journal – 9/2/17
Source: The Federal Reserve, Real Investment Advice – 10/16/17
Policy: Policy recommendations by indicator are outlined below to shift our economy back to one where the 90 % of families have reasonable incomes, can pay their bills, purchase homes and household appliances to fuel our economy. Our economy is stagnant because most income and assets are held by the top 1 % and they have consumed all they can. The economy is destined to stagnate or worse slip into a depression with income and assets concentrated in the top 1 %. When did this happen before? In 1929, the year of the stock market crash, income and assets were concentrated in the top 1 % similar to levels seen today.
GDP
US Growth Slowing: GDP (Gross Domestic Product) for the 2nd quarter of 2017 has just been announced as 3.0 % – better than 1st Qtr which was revised down to 1.3 %. The biggest boost to the GDP figure was from a reduction in inflation for the 2nd Qtr and more consumer spending.. The inflation reduction is a result of stagnant wages, and a general economic slowdown not affording businesses the ability to raise wages. However it is still about 2.1 % for all of 2017. For the past 7 years since the 2009 recession GDP has averaged 1.9 %. For the previous 20 years GDP was on average twice that rate at 3.8 %. This means that the economic pie is twice as small and growing smaller for the working class to move up and gain equity in income and wealth.
Policy: We should increase investment in infrastructure, business research and development, education, labor force participation, immigration and exports.
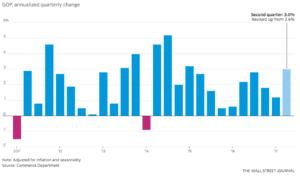
Source: The Commerce Department, The Wall Street Journal (GDP by Qtr) – 8/30/17
Trade
Trade Grows Our Economy, Yet a Cloud of Protectionism Hangs Over: While, world trade is up by volume might this be a Trump – hope bump to beat protectionist policies? It is not clear yet. One reason that GDP growth was so strong prior to the recession is that world trade was growing at 2 times the rate of GDP. Since the recession world trade (G 20 developed countries) has not returned to previous levels. Protectionism is growing as the G-20 country finance ministers could not agree to leave a phrase against protectionism in their communique at their meeting the weekend of March 19-20 2017. The World Trade Organization now counts 2200 restrictive trade measures taken by members since 2010 – a four fold increase. The present GOP administration has begun trade wars by announcing a tariff on Canadian soft wood lumber and threatening Mexico with import tariffs on imports particularly affecting auto manufacturers. The number of trade actions filed by the US against subsidies and dumping has picked up this year.
Policy: Focus on a win-win trade set of initiatives, while looking out for American interests we need to help other economies grow so they will in turn buy more US goods and services. This win-win trade approach has worked for 70 years since WWII, we know from the history of the 1930s that protectionism will cause deep economic pain and set the stage for possible wars.
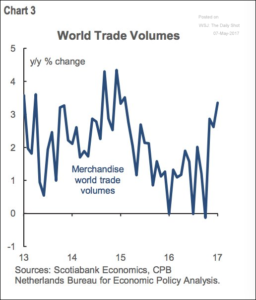
Source: Scotiabank Economics, Netherlands Bureau for Economic Policy Analysis, The Wall Street Journal, The Daily Shot 5/8/17
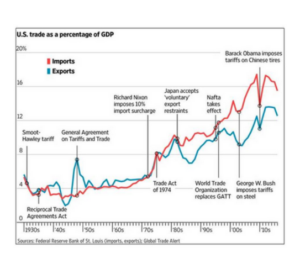
Source: Federal Reserve Bank – St. Louis, Global Trade Alert – 3/3/2017
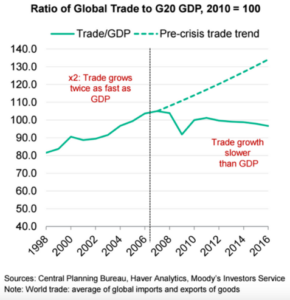
Source: Central Planning Bureau, Haver Analytics, Moody’s Investor Services – 3/1/ 17

Source: WTO – Wall Street Journal – 3/20/17

Sources: World Trade Organization, The Wall Street Journal, The Daily Shot – 10/19/17
Consumer Spending
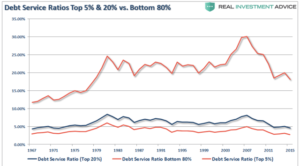
Consumer Spending is Down: In spite of all the consumer sentiment surveys (soft data) that indicate new highs with the Trump Bump, real consumer spending is down to the lowest levels since the recession in 2009. The Personal Consumption Expenditure (PCE) Index for last month is barely above 0 % and if inflation were added in it is negative by 1.8 %. The PCE for 1st quarter 2017 showed growth at just . 3 % the lowest level in 7 years. Part of the reason is that real wage increases have been stuck in the past 5 years at about 2.5 %, yet housing, healthcare and gasoline costs have increased – squeezing the working class. Inflation has recently averaged 2.0 %, and consumer debt has climbed as households borrow to make up for the deficit in income. Since March of 2016 consumers have been living beyond their means with spending beyond disposable income (after taxes) by 1.1 % for last month. Disposable income by quintile shows that for 80 % of Americans their incomes have increased over the past twenty years at a slow rate which is eaten up by inflation. A Gallup survey showed that a typical family of four in the US needs $53,000 in income per year to breakeven, yet 80 % of US households are not making that income level on a gross income basis. Consumer debt is at a 9 year peak today as households maintain their standard of living with PCE at a new high as a percentage of GDP . Plus, because the majority of households are spending 5 times more in interest payments than the top 5 % there is little income left to spend on new purchases. This will not end well, as some deleveraging (crash) event will take incomes down and asset values to sustainable levels. Consumer spending is 70 % of GDP, so constrained consumer spending is contributing to continuing slow growth in GDP.
Policy: We need a national labor policy that puts workers first, ending stock buybacks by corporations and instead use those funds for raising wages. Plus, pass legislation to increase the federal minimum wage and increase affordable child care for working mothers. Investments in training for higher paying manufacturing jobs in partnership with corporations would raise the overall wage level. Providing job seekers job search tools and services will balance the job seeker position in the job market.
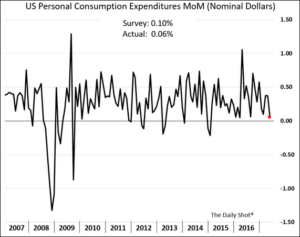
Source: The Wall Street Journal, The Daily Shot – 7/3/17
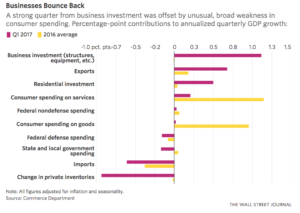
Source: The Commerce Department, The Wall Street Journal (1st Qtr 2017) – 4/28/17

Source: Oxford Economics, Haver Analytics, Market Watch – 8/2/17
Sources: New York Federal Reserve, Real Investment Advice – 9/1/17
Sources: New York Federal Reserve, Real Investment Advice – 9/1/17
Sources: New York Federal Reserve, Real Investment Advice – 9/1/17
Sources: New York Federal Reserve, Real Investment Advice – 9/1/17
Labor
Labor Wages Way Below Increasing Profits: Since the Reagan years labor has lost pace with corporate profits as a percent of GDP. Basically, the labor piece of the pie has been getting smaller and smaller by at least 34 % since 1980. While, corporate profits have increased by two times in the same period! These soaring profits have been largely at the expense of labor – reduced wages and automation increasing productivity translates to fewer workers. In industry sectors like services, corporate concentration over a five year period from 2007 to 2012 has left workers with a lower share of corporate income.
Policy: We need a strong Marshall Plan type labor policy with a number of key elements: apprenticeship programs on the scale of Germany’s effort, reduction of student debt, free college education, corporate governance reform with employee councils to balance corporate power, end to stock buybacks and tax deductions for corporate executive compensation, ceiling on CEO and executive pay (through incentives first – taxes second), and corporate taxes increased to pay their fair share.
Source: BEA, St. Louis Federal Reserve Bank – 8/31/16
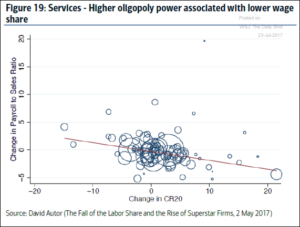
Source: David Autor – Professor of Economics, MIT, The Wall Street Journal, The Daily Shot – 7/23/17
Jobs – Earnings – Young People
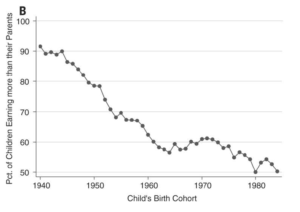
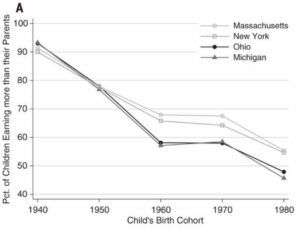
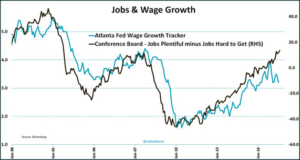
Children Earning 40 % Less Than Their Parents: An April study notes that children born in 1940 were 90 % likely to earn more than their parents, this dropped to 50 % for children born in 1980 and continues to be low. This lack of income mobility is not evenly distributed across the US, as it is much worse in states like Ohio, and Michigan versus Massachusetts and New York. Older workers stayed in the workforce after the recession to make up for lost earnings, this put pressure on corporations to hold wage costs on prime age workers. Plus, they continued to concentrate their business with mergers, used the Internet to create candidate competition, hired H1- B Visa immigrants and automated their businesses reducing young workers wage bargaining power.
Policy: The authors of the study recommend: distributing current GDP growth more equally across income groups as in the 1940 birth cohort would reverse more than 70% of the decline in mobility. Focused innovation zones (Silicon Valley model) in inland states hard hit by manufacturing job loses, tax corporations their fair share to pay for free college education, reductions in student debt and taxes on the wealthy to pay for income safety net programs and healthcare (which takes such a big share of income).
Source: Chetty et al, Stanford University, Harvard University, UC Berkeley – Science Magazine 4/6/17
Source: Chetty et al, Stanford University, Harvard University, UC Berkeley – Science Magazine 4/6/17
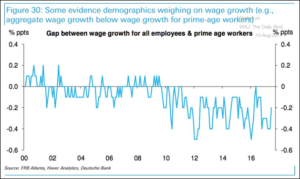
Sources: Federal Reserve Bank Atlanta, Haver Analytics, Deutsche Bank, The Wall Street Journal, The Daily Shot – 8/10/17
Jobs – The Hidden Workers Economy
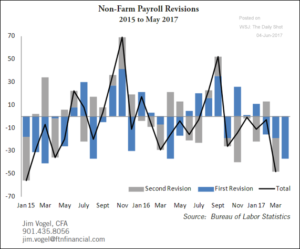
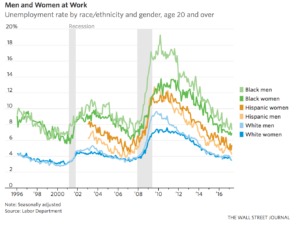
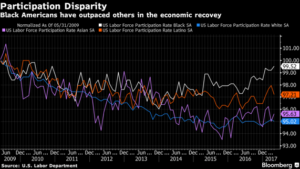
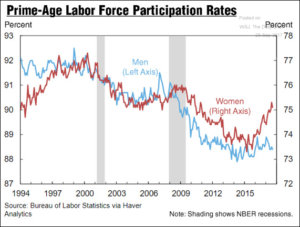
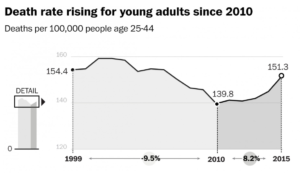
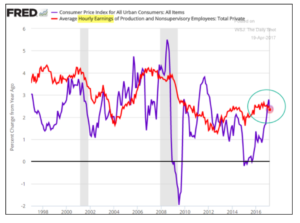
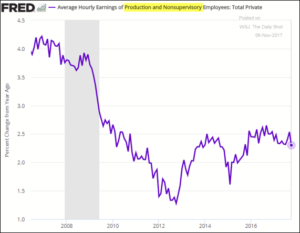
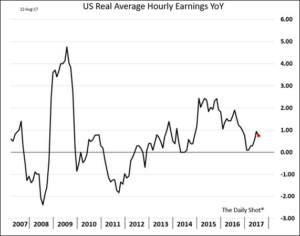
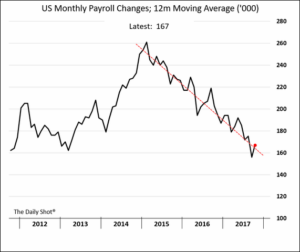
Hiring Up Overall, Yet Hidden Stagnant Economy: A look below the glowing BLS figures of low unemployment shows there is a hidden and stagnant economy for the working class and poor. There has been a significant decline in employment in S & P 500 companies to 2008 recession levels as reported by counting employment figures from corporate reports. Employment figures are continuing to be revised downward. Retail businesses are still laying off workers, and those working part time for economic reasons were still higher than the recession of 2008 – 2009. But, workers with less than a high school education are stuck in unemployment limbo, while only college educated workers are coming close to pre-recession levels. Employees without a college education had the highest rate of unemployment. Blacks and Hispanics had unemployment rates of 7.5 % and 5.2 % while wage increases for production and non-supervisory workers were stagnant and have not returned to pre-recession levels. Blacks did make a significant improvement in employment – but largely due to the ‘first fired last hired’ business attitude. Women have a higher labor participation rate than men, but still are low compared to other OECD countries. Men have a lower workforce participation rate losing economic leverage they enjoyed prior to the Great Recession. The increasing death rate of whites, native americans and hispanics that are non college educated in the key 25 – 44 year old workforce group is a major concern. It is contributing to a slowing labor force participation rate – in addition to the loss of these young people to their families and the country. Those unemployed over 27 weeks tended to stay unemployed. There is a persistent skills gap keeping openings to hire ration stuck since 2015. Often these are older workers who can’t find work who stayed on unemployment benefits until exhausted. People working part time for economic reasons is still 24 % above pre-recession levels. They are taking 2 and 3 jobs just to get ahead since wages are zero when adjusted for inflation and higher for the working class. Payrolls continue down, management is not interested in hiring more workers, but installing automation tools, robots or software. For all workers it is just 1.0 % to .5 % wage growth versus inflation. Inflation is two-thirds driven by the cost of housing (rising a 6 % per year) or Personal Consumer Expenditure (inflation) of just 1.5 %. A comparison of the number of jobs to wages shows the breakdown in the last year of increasing wages to available jobs. Economists believed that in tight labor markets wages would move up as employers would have to increase wages to stay competitive – but not anymore. The job market is heavily weighted toward corporate recruiting (ie. LinkedIn was designed for corporate recruiters not job seekers). Corporations have the upper hand with hundreds of resumes per job versus job seekers trying to get an interview. Wages are held down by limited productivity increases particularly in services which are a challenge to increase productivity, the gig economy, corporate oligopolies, and executives holding the line on wages to increase profits. Plus, inflation staying low has not put pressure on businesses to raise wages.
Policy: We need investments in large scale apprenticeship programs, free higher public education (just like K-12), targeted economic and education zones where laid off workers are locked in unemployment, and support for jobs of the future in an automated production and office workplace. We need to increase the female participation rate by offering subsidized child care, paid family leave time and other family friendly policies.

Source: Bloomberg Finance, Deutsche Bank Global Markets Research – 6/6/17
Source: FTN Financial – The Wall Street Journal, The Daily Shot 6/4/17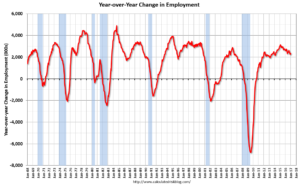
Source: Calculatedriskblog.com 6/6/17

Source: Bureau of Labor Statistics – The Wall Street Journal 5/5/17
Source: Bureau of Labor Statistics – The Wall Street Journal 5/5/17
Source: Bloomberg – 5/11/17

Source: The Wall Street Journal, The Daily Shot, OECD – 2015
Sources: Bureau of Labor Statistics, Haver Analytics, The Wall Street Journal, The Daily Shot – 9/25/17
Source: The Wall Street Journal – 6/9/17
Source: Federal Reserve Bank of St. Louis – The Wall Street Journal, The Daily Shot (production and non-supervisory workers) – 4/19/17 (March Report)
Source: Federal Reserve Bank of St. Louis, The Wall Street Journal, The Daily Shot (production and non supervisory workers) – 11/6/17
Sources: The Wall Street Journal, The Daily Shot – 8/12/17

Source: Bureau of Labor Statistics (long term unemployment) – The Wall Street Journal, The Daily Shot – 9/4/17

Sources: Federal Reserve Bank of St. Louis – The Wall Street Journal, The Daily Shot – 9/4/17
Sources: Federal Reserve Bank of Atlanta, Bloomberg – 7/28/17
Sources: The Wall Street Journal, The Daily Shot – 11/6/17

Sources: Credit Suisse, Bureau of Labor Statistics, The Wall Street Journal, The Daily Shot – 8/14/17

Sources: Department of Commerce, Thomson – Reuters, The Wall Street Journal, The Daily Shot – 10/2/17
Jobs – Automation
Low Wage Jobs Vulnerable to Automation: Those jobs where pay is less than $20 per hour are most likely to be automated – particularly in distribution and manufacturing. Amazon plans on ‘hiring’ 45,000 robots in 2016 to automate their distribution centers. Amazon just received approval on several patents to automate janitorial services in warehouses. Researchers suggest that new jobs supporting robots will be created – yet the skills for robot software development and support are very different from being a janitor. Robots are penetrating the auto and electronics industries at a significant pace, now 175 robots per 10,000 workers in manufacturing in the US.
Policy: Working in partnership with corporations we need to implement job training, and development programs that help workers replaced by automation to work in new jobs like automation management, customer support and automation maintenance.
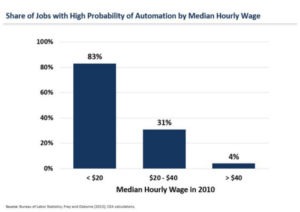
Source: Bureau of Labor Statistics, Frey and Osbourne – 3/2/17

Source: Amazon, The Seattle Times, Statista 1/9/17

Source: International Federation of Robotics – 2016
Jobs – Automation of Higher Order Skills
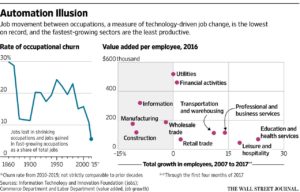
New Jobs Require More Social and Math Skills: An analysis (soft data) of the number of jobs that grew between 1980 – 2012 shows an increasing emphasis on social and math skills while other more physical skill sets are being automated. Many human skills will be automated in the future as noted in the second chart. Think about driverless cars – while a driver is not needed, a companion to assist an elderly patient to the doctor would be required.
Policy: Corporate, non-profit and government organizations need to invest significantly more in training, education, apprenticeship and support services for the jobs of the future.
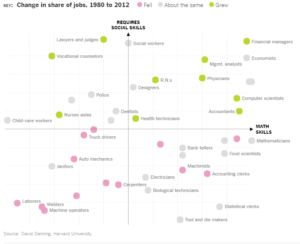
Source: David Deming, Harvard University, World Economic Forum – 3/8/17

Source: McKinsey Global Institute – 2/28/17
Jobs – Automation of Retail
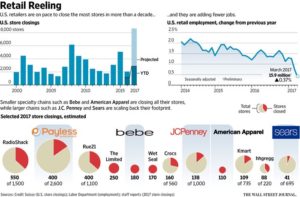
Amazon Deploying Automated Stores: Amazon continues its juggernaut in retailing, now automating retailing with its Amazon Go stores. Customers are tracked where they go in the store, when they decide to buy they pick up the item and leave the store and their Amazon account is debited. The benefits to customers are no lines, no checkout. While they are still working on customer acceptance and scaling, it is a prototype of one future for face to face retailing. So, as Amazon has become the 800 pound gorilla of retail online, they threaten to change the in person retail experience as well. 44,000 retail positions were lost in 2016 alone. Retail hiring has been falling for the past three years to a low of 15.9 million workers. Plus, new businesses like Stitch Fix at $500 million in sales offer style subscriptions to consumers to buy clothing online, review clothes in their home and never set foot in a store. Overall, eRetailers are 3 times more productive on a per employee basis versus brick and mortar retailers. Hiring for eRetailers is rising while store retailers continue layoffs at 17 – 15 % rate this year. Store retail jobs in heartland regions are falling as Amazon creates automated distribution warehouses with fewer jobs near metro regions.
Policy: Amazon and other major corporations are changing the face of retailing both by selling goods that were originally sold in stores online, but changing the face to face experience in stores. A major (scale of the GI Bill in 1945) job training, development and transformation of heartland regions needs to be funded by the federal government in partnership with corporations who are benefiting from the automation of retailing.

Source: YouGov, Statista – 3/27/17
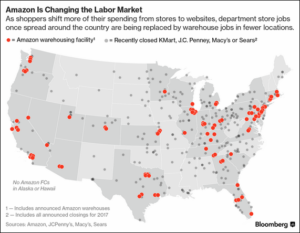
Sources: Bloomberg, The Wall Street Journal, The Daily Shot – 9/22/17

Source: Census Bureau, The Wall Street Journal, The Daily Shot – 2/26/17
Source: Credit Suisse – Bureau of Labor – The Wall Street Journal 4/25/17
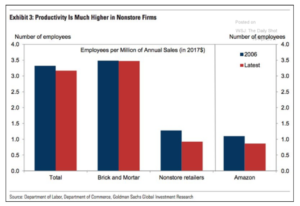
Source: Department of Labor, Department of Commerce, Goldman Sachs – 4/19/17
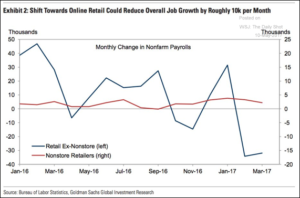
Source: Bureau of Labor Statistics, Goldman Sachs, The Wall Street Journal, The Daily Shot – 5/11/17
Jobs – Restaurant
Restaurant Industry in Recession: The restaurant industry employs over 14.4 million workers. The industry has experienced falling sales for the last 9 of 10 months, and compared to last year sales are down 2.5 %. Only 8 of 195 markets are seeing increasing sales. The only growth segment is the upper scale fine dining serving the Top 1 %. Economists think for February that the delay of tax refund checks to 40 million consumers for the earned income tax credit hurt sales. But what happened in all the previous months? Consumers are squeezed with increasing costs of gasoline, education, health care and rent. There is little room in budgets for dining out or even takeout.
Policy: Apprenticeship programs need to be deployed to help workers develop increased skills for new Internet based food delivery services, management training, a reduction of taxes overall on the working class to increase restaurant sales and federal minimum wages increased. Productivity and innovation research programs need to be funded to reduce costs and support increased wages.

Source: Bloomberg – 3/31/17

Source: February Sales – Tdn2k.com – 3/31/17
Productivity
Productivity Levels Dropping: Real output per person hour has been dropping below pre-recession levels of 2008, now below 1%.. Services in health care, education and government in particular have been slower in adopting productivity improvements. Do we want a doctor to evaluate a patient with cancer quicker? Lower productivity means that while the economy is growing slowly efforts to increase growth face strong headwinds.
Policy: Corporate investment in training, innovation and technology needs to be increased instead of wasting money on stock buybacks. Government investment in education, basic research and innovation will provide new technology and techniques to increase productivity.
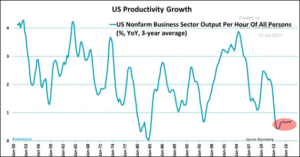
Source: The Wall Street Journal – The Daily Shot – 7/13/17
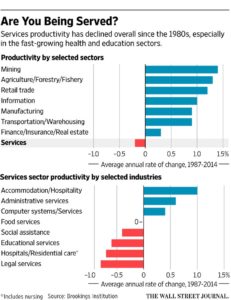
Source: Brookings Institution, The Wall Street Journal – 10/30/2016
Source: Information and Innovation Technology Foundation, Department of Commerce, Labor Department, The Wall Street Journal – 5/18/17
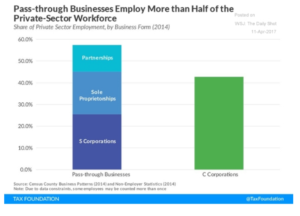
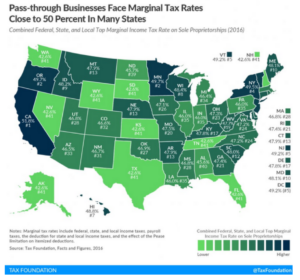
Small Business – Taxes
Small Businesses Employ 50 % of the Workforce, Yet Pay 4 Times the Corporate Tax Rate: Many small businesses are called pass through businesses where they are unincorporated and pay taxes directly on their individual tax return. Small businesses employ over 50 % of the private sector workforce yet pay nearly 4 times what corporations pay – an effective corporate tax rate of 12.9% according to the GAO.
Policy: We need to lower taxes on small businesses to 25 % (pay for it by increasing the effective corporate tax rate), particularly if they investment in the business to increase productivity or train and development their staffs.
Source: Tax Foundation & The Wall Street Journal – The Daily Shot – 4/12/17
Source: Tax Foundation, The Wall Street Journal – The Daily Shot – 4/12/17
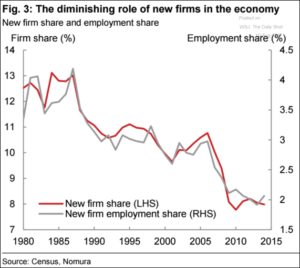
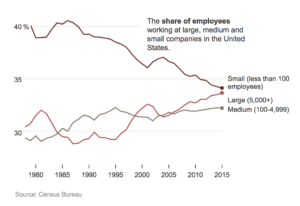
Small Business – Formations
Small Business Formations Way Below Average: Since the 2008 recession the number of new business formations has been falling against the expected average since the 1980s. This trend in lack of new businesses has occurred while corporate concentration continues at an unparalleled pace allowing mega corporations to establish high barriers to entry for new businesses. In effect, we are missing over 600,000 new businesses hiring workers, innovating new products or services and invigorating our economy. New businesses accounted for 4 % of the hiring in the US in 1980, today just 2 % so a reduction in new businesses formations is destroying one of our key job growth engines. Often small businesses create new innovations that increase productivity, yet our economy is not receiving the economic lift these missing small businesses would provide.
Policy: Our federal antitrust department has been asleep the last twenty years. It is time to formulate a policy around no corporation having more than 20 % market share in terms of revenue or profits. Patent policy needs to be reset to reduce the number of years that corporations can patent a process as today they can effectively raise an extremely high barrier to entry for new innovative companies. We need to be opening new windows of opportunity for entrepreneurship to create new businesses and jobs.
Sources: Census Bureau, Nomura, The Wall Street Journal, The Daily Shot – 8/10/17

Sources: US Census Bureau, Goldman Sachs, The Wall Street Journal – The Daily Shot – 7/25/17
Sources: US Census Bureau, The Wall Street Journal – 9/22/2017
Corporate – Debt
US Corporations Issue Debt to Finance Wealth: In the last 6 years US corporations have issued at least 2 times more than corporations in other developed countries in stock buybacks, dividends and mergers/acquisitions. This miss guided allocation takes needed capital investment in people, technology and equipment. Most of this financial engineering was funded by increasing amounts of corporate debt taken on by low interest rates keeping payments are low. Multiples of corporate debt versus earnings are at an all time high since the 2008 recession.
Policy: End stock buybacks by corporations, offer incentives for training and development in employees and reduce tax breaks and loopholes for M & A activity which concentrate sector control and wealth into too few corporations.
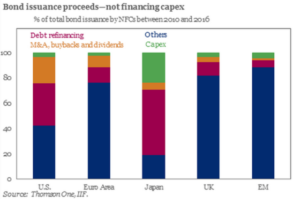
Source: Thomson One, IFF – 3/9/17

Sources: The Wall Street Journal, The Daily Shot – 7/27/17
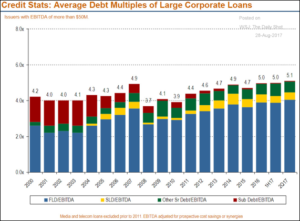
Sources: The Daily Shot, The Wall Street Journal – 8/17/17
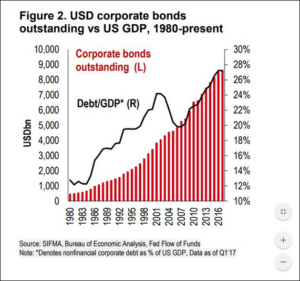
Sources: SIFMA, Bureau of Economic Analysis, The Wall Street Journal, The Daily Shot – 9/22/17
Corporate – Stock Buybacks
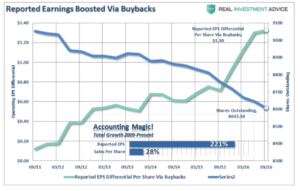
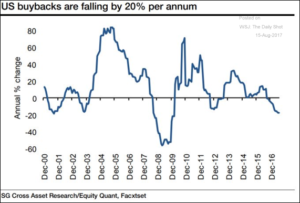
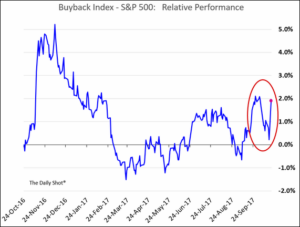
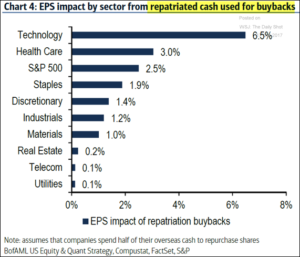
Stock Buybacks Inflate Market Value, Take Funds from Workers: Stock buybacks are used by corporations to manipulate the price of their stock upward to increase compensation, primarily to executives who receive generous stock plans. In healthcare, Aetna, Cigna, Anthem and Blue Cross along with drug companies like Pfizer, Gilead executed $14 billion in buybacks in 4th Qtr 2016. What this means is that we as patients are involuntarily supporting fraud in the marketplace causing drug and insurance prices to be in inordinately high. For example, Mylan, manufacturer of Epipens gouged consumers by 578% over the past five years, while buying back $1 billion of stock in the last year alone. The cost of the 2-Epipen set is estimated at $2 billion, if they had not wasted the money on stock buybacks Mylan could have cut the cost of Epipens by $50 %! Plus, all this discussion by the health insurers that they are not making enough money from the ACA law is inaccurate, if they just stopped stock buybacks they would have billions of dollars to lower prices to patients. Finally, stock buybacks create profitability reporting that is misleading. For example, if a company earns $0.90 per share and has one million shares outstanding – reducing those shares to 900,000 will increase earnings per share to $1.00. The company has not materially increased profits but instead has misrepresented profits by manipulative financial engineering. Since 2011 earnings (non GAAP reporting) per share of S & P 500 stocks have been hyped by 221 %! In 2016 corporate income was actually negative, if hadn’t been for stock buybacks saving the day until the 3rd Qtr of 2016. Stock buybacks are falling, as corporations are finding limits to their ability to borrow to repurchase stock and pressure from analysts has an impact. Yet, with the just announced Trump tax reform giveaway to corporations assigning just a 10 % tax on offshore funds, corporations are expecting to have a new pot of hundreds of billions of dollars to hype their stock price via stock buybacks. The shares of firms most likely to use offshore funds to pursue buybacks have soared in value recently. The Technology and Healthcare sectors look to juice their stocks with offshore funds from 6.5 % to 3.0 % with the S & P average of 2.5 % – all misleading numbers, earnings have been increased but instead are manipulated to goose stock prices and executive compensation.
Policy: End stock buybacks immediately, phasing them out over a 6 month period as analysts estimate that as much as 10 % of S & P 500 market capitalization is a result of stock buybacks. This change can be accomplished by SEC order as it was setup by a directive in 1993.
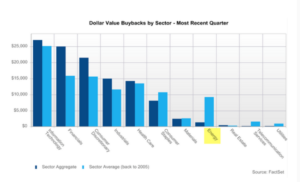
Source: Factset – 3/10/17
Source: Real Investment Advice – 5/10/17

Source: Deutsche Bank – 6/7/17
Sources: 50 Cross Street Research, Equity Quant, Facxtset, The Wall Street Journal, The Daily Shot – 8/15/17
Sources: The Wall Street Journal, The Daily Shot – 10/23/17
Sources: Bank of America, US Equity & Quant Strategy, Compustat, Factset, The Wall Street Journal, The Daily Shot – 10/17/17
Corporate – CEO Pay
CEO Pay Hits New Post Recession High, While Production Workers Wages Stagnate: CEO pay increased by 6.8% year/year to a record $11.5 million since the 2008 recession while production worker pay has stagnated at 2.5 % wage increases. When inflation is factored in workers pay has not increased at all. This is the story of two economies, one working for rich while the other is for the middle class not improving – this situation is a gross injustice. Plus, bad for our economy as the middle class spends their money on goods and services while the rich can’t buy more after acquiring all the goods and services they can possible use.
Policy: The City of Portland, Oregon has passed a tax on CEO pay where if it is 100 times average worker salary, then the firm is charged a surtax of an additional 10 % and at the 250 times level a 25 % tax is awarded. Another approach, would be to offer shareholders direct executive compensation voting privileges or workers the right to vote on compensation (stock, income and benefits) packages for the top 25 executives. Plus, there is no reason that tax payers should be supporting exorbitant executive pay with a corporate tax deduction on stock compensation above $1 million.

Source: MyLogic, FactSet, The Wall Street Journal – 3/21/17
Corporate – Taxes
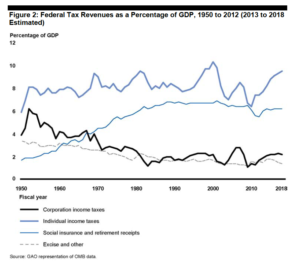
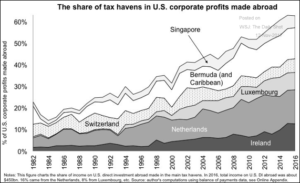
Corporations Pay An Effective Tax Rate of 12.9 %: The Government Accounting Office found for corporations with at least $10 million in assets paid an effective federal tax rate of 12.9 %. Reviewing the history of corporate taxes they were as high as 29 % in the 1950s, dropping to 10 % in total receipts in 2013. Corporations took advantage of a deduction for interest on corporate debt, accelerated depreciation, and moving profits offshore shielding them from the US. In terms of percentage of GDP, corporate taxes reached 6 % in 1955 down to about 2 % in 2013 – a 66% reduction. Corporations were paying less in federal taxes while personal income taxes were increasing by 200 % to 6 % of GDP. Businesses effective flipped their tax burden onto individuals, and working class citizens felt the burden the most. Multinational corporations headquartered in the US, stash over 60 % of overseas profits in tax havens like Singapore, Bermuda and the Caribbean, Switzerland, Luxembourg, The Netherlands and Ireland. The federal government loses billions of dollars each year as multinationals cut government corporate tax revenue by 20 – 30 % by using these tax havens. They are avoiding paying their fair share of taxes on funds made overseas receiving the benefits of our armed forces making the world safe and economically secure for them to do business.
Policy: We need to require that corporations pay their fair share of taxes, by ending tax loopholes, deductions for corporate executive compensation pay above $1 M, and parking billions of dollars in tax safe havens overseas. Corporations should be paying for the DoD costs of having the world’s largest armed services operation to keep the world safe for their businesses. Taxing offshore profits is a responsible way to ensure businesses pay for the services they enjoy, just as domestically they pay taxes for security forces, movement of commerce freely, roads, airports and education services that enable them to successfully run their business.

Source: GAO Report – 5/13
Source: GAO Report – 5/13
Sources: Zucman – UC Berkeley, Torslov & Wier – U of Copenhagen, The Wall Street Journal, The Daily Shot – 11/13/17
State and Local Government – Taxes
State and Local Tax Receipts Are Down: State and Local governments are feeling a financial pinch, as income taxes from individuals and corporations fall the most since the recession of 2009. This is a critical issue, as many people dependent on state and local government for medical, food and shelter assistance. We need more stable tax sources to provide a safety net under those that have very little to weather an economic slowdown.
Policy: The Internet is a growing part of our economy, and yet does not pay its fair share of taxes. On certain purchases firms like Amazon pay no taxes to local or state government (items shipped by third party). While Amazon does pay state taxes in 39 states it escapes them on some purchases that would be performed at a local brick and mortar retailer. Tax exclusions need to be reviewed for corporations, and wealthy individuals to pay their fair share.

Source: B of A Merrill Global Research, BEA, Bureau of Labor Statistics – 7-5-17
Immigration – Economy
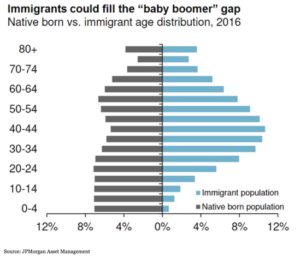
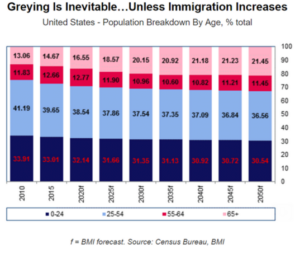
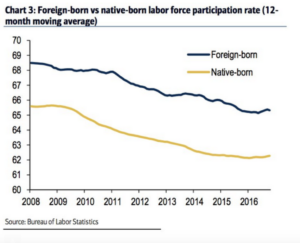
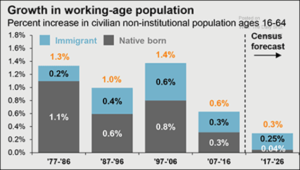
Immigrants Key to Growing Our Economy: As our population ages we need to increase our working age population. Our labor force participation rate has stagnated at 63 % for several years, with foreign born workers participating at a higher rate than native born workers. To increase our working age population 24 – 49 years old we must welcome immigrants – our working age popular is aging out. By increasing our workforce we can increase GDP growth and provide a workforce to support our senior population and youth.
Policy: We can learn from Canada where they actively recruit college students, offer incentives to stay and join the workforce. We need to welcome immigrants, assist them in becoming educated citizens and participants in the workforce.
Source: JP Morgan Asset Management – 3/7/17
Source: BMI, Census Bureau – 3/4/17
Source: Bureau of Labor Statistics – 12/2/16
Source: JP Morgan Research, The Wall Street Journal, The Daily Shot – 6/4/17
Immigration – Mexico
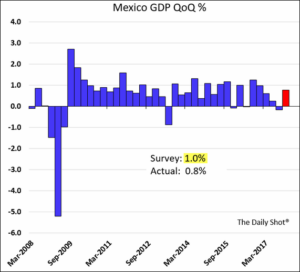
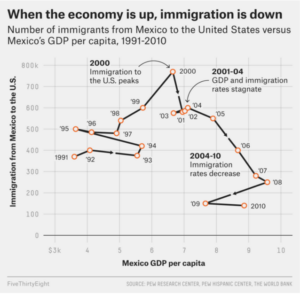
Mexican Immigration Is Down When Per Capita GDP is Up: When the Mexican economy is doing well, immigration into the US is down. Mexicans don’t need to migrate for better jobs or incomes when they are doing well. With NAFTA threats the present administration is creating so much uncertainty that local business leaders are not making investments. Plus, US firms are holding off any plant investment until its clear what will happen with the agreement. The economy is now contracting likely causing more Mexicans to look at migrating north. In the 3rd quarter of 2017 the Mexican economy slipped into recession then backed out a bit in the most recent quarter (red). Economic activity is slowing as POTUS threats to leave NAFTA are having a damaging impact.
Sources: The Daily Shot, the Wall Street Journal – 2/26/18

Sources: The Wall Street Journal, The Daily Shot – 1/17/18
Policy: With all the discussion of immigrants from Mexico pouring in we see that a win-win policy would work from the chart below. The facts don’t bear out an anti-Mexico immigration policy as being helpful. By implementing a policy of a win-win trade relationship we won’t need a wall. A strong Mexican economy is the best way to reduce illegal immigration.
Source: Five Thirty Eight, PEW Research, The World Bank – 2/28/17
Household Debt
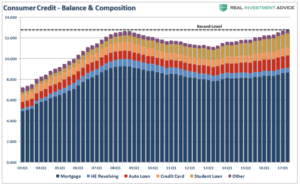
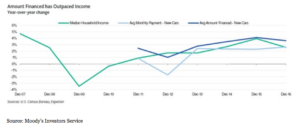
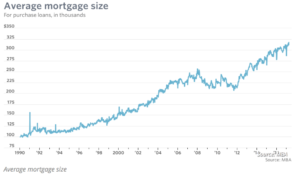
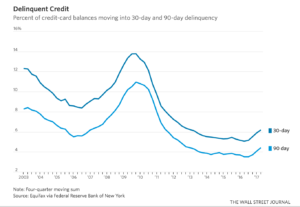
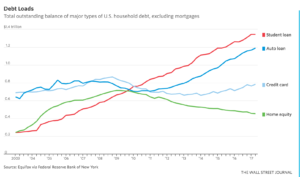
Household debt is at Great Recession levels: Household debt has ballooned to $12.48 trillion since 2008, with mortgage debt largely under control yet auto loans and student debt soaring. Auto loans are now higher by $367 billion. Over the past 3 years workers have been spending more on their auto loans than their household income can afford. They are making up the difference in taking on more debt. Owning a car is crucial for workers to get to work in most areas – this is not a discretionary purchase for most people. Student loans are higher by $671 billion. Seniors are now shouldering more debt as well due to losses in retirement funds during the Great Recession, rising medical costs and taking on student debt. Plus, mortgage holders are taking on the largest mortgages in the last thirty years. First time buyers are putting down an average of 6 % on home purchases and are leveraged more than at the peak of the Great Recession. Credit cards are being used to make ends meet by worker households, and they are stretched thin as credit card charge offs by financial services firms are rising.
Policy: The squeeze for working families is seen acutely in their taking on super large mortgages, longer and more expensive auto loans along with student debt. Wages must be increased with raises from businesses by ending stock buybacks and using those funds to raise salaries, invest in research and development to increase productivity and reform corporate governance to share power with employees. For seniors social security and medicare compensation should be indexed to the CPI – E or elder cost of living standard that accurately describes the cost of living for seniors. Incentives for housing developers need to be implemented to build housing priced at levels that the working class can afford rather than the wealthy high margin segment.
Source: NY Federal Reserve Bank, Real Investment Advice – 9/1/17
Source: Moody Financial Services – 3/28/17

Source: NY Federal Reserve Bank 4/3/17
Source: Mortgage Bankers Association – 4/4/17
Source: The Federal Reserve Bank of New York, The Wall Street Journal – 8/15/17
Sources: The Federal Reserve Bank of New York, The Wall Street Journal – 8/15/17
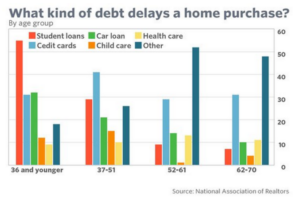
Student Debt
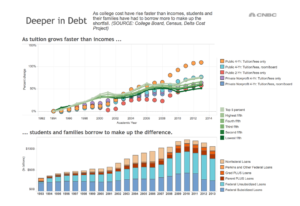
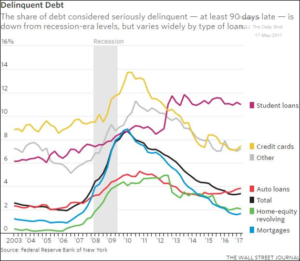
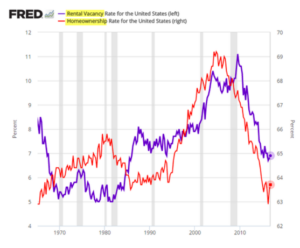
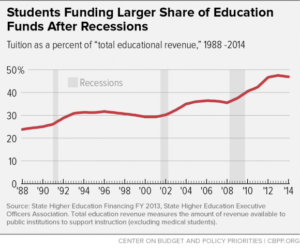
Student Debt Limits Young People’s Ability to Buy Homes: Students carrying a heavy load of debt due to lack of federal and state funding of higher education are delaying purchases of homes. Their inability to buy a home means that household creation is declining and along with it orders for appliances, carpeting, furniture, and household goods. We have seen a flat rate of growth over the past several years in consumer durable goods orders. Home ownership rates are back to 1995 levels, with rental vacancy rates back to pre-1970s levels. Parents are picking up more student debt, they have borrowing to make payments, default rates are higher than the subprime mortgage default rate in 2008. Subsidized loans by the federal have declined placing more financial burden on families. A total of $180 billion in debt will likely never be repaid, and will need to be forgiven at taxpayer expense the GAO estimates. The government garnished 173,000 student-loan Social Security checks in 2015 up from 36,000 in 2002. The Consumer Financial Protection Bureau reports for 2014, that 40 % of Americans age 60 and above with student loans – usually for children or grandchildren had skipped necessary healthcare! This figure compares with 25 % of Americans age 60 and above without student loans going without healthcare (still way too high). State and local governments have not brought public college and university funding back to pre-recession levels of 2008, and students are now picking up twice the costs of rising tuition compared to 1988. We have essentially mortgaged our children’s education, careers and future standard of living (mired in debt), particularly for the middle class where their incomes have stagnated since the 1980s versus the elite top 1 %. If this wasn’t bad enough delinquency rates have soared in the last 3 years for student debt.
Policy: Federal and State governments need to pick up the costs of higher education, first at the community college level to ensure that an AA degree is free, and finally transition to a free public higher education for any qualified student wishing to obtain a bachelor’s degree. Students should be offered an opportunity to rollover their debt to lower cost loans at the Federal Reserve rate now .75 % plus 2 % for margin. Banks owe the American people a decent rate in return for providing cheap publicly funded recession bailout TARP loans. Students should not be burdened with overriding debt in beginning their new careers and setting up a household. The present administration is tightening the rules on loan forgiveness – we should be moving in the opposite direction to end the delinquency rate increase.
Source: National Association of Realtors – 3-6-17
Source: College Board, Census, Delta Cost Project – CNBC – 2014
Source: The Federal Reserve Bank, The Wall Street Journal – 5-12-17
Source: Federal Reserve Bank St Louis, The Daily Shot – 3/1/17
Source: Federal Reserve Bank St Louis, The Daily Shot – 4/28/17

Sources: Government Accountability Office, Department of Education, The Wall Street Journal 4/24/17
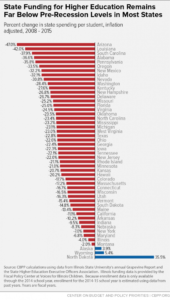
Sources: Illinois State University, Higher Education Officers Association and Center on Budget and Policy Priorities – 5/13/2015
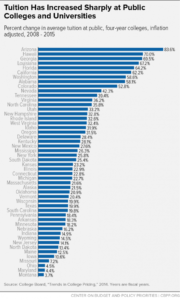
Sources: Illinois State University, Higher Education Officers Association and Center on Budget and Policy Priorities – 5/13/2015
Sources: Illinois State University, Higher Education Officers Association and Center on Budget and Policy Priorities – 5/13/15
Housing
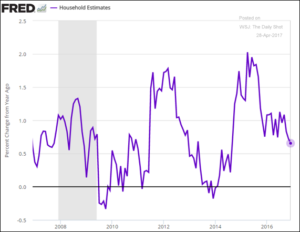
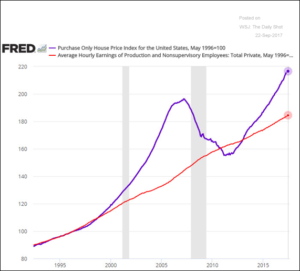
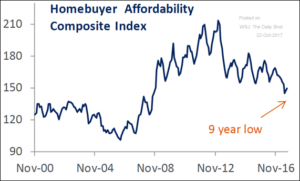
Older Home Owners Stop Moving, Affordability Gap Widens : Seniors faced with mounting medical costs, paying for child or student loan debt and stagnant wages are deciding to stay put. The tenure for home ownership is now at a peak of 8.7 years. This stalling in sales cuts the home formation level and velocity of home formations. Household formations are at the lowest level in 10 years. Only 63% of the population owns a home, the lowest rate in 27 years which reached a high of 69% in 2008 prior to the recession. The housing Affordability Gap for the working class continues to widen against stagnant wages, now at a 9 year low. Wages have not kept up with rents since 2013. The present GOP Administration policy of protectionism on imports from Canada has caused lumber prices to soar (as there are not good US substitutes) and will add to the widening gap in affordability. The economy in the last 9 years has done little for the working class to gain good wages, reduce debt and increase the market of affordable homes to purchase so they can build equity for retirement. Sales for durable goods like appliances, furniture and housewares are all either lower than a year ago or holding at present levels.
Policy: We need to lower student debt interest rates, with refinancing or elimination of debt, reduce medical costs for seniors where medical costs are a major percentage of their budget. Indexing Social Security payments so seniors can at least keep up with inflation would help, so home purchase financing looks favorable and the increased costs of moving are handled more easily. Plus, tax credits and incentives for first time home buyers along with urban planning guiding developers to building homes under 1800 square feet which would reduce prices.

Sources: Moody Analytics, The Wall Street Journal – 5/18/17

Sources: Moody Analytics, The Wall Street Journal – 5/18/17
Sources: Federal Reserve Bank – St Louis, The Wall Street Journal, The Daily Shot – 9/21/17
![]()
The Federal Reserve Bank – St. Louis, The Wall Street Journal, The Daily Shot – 11/9/17

Sources: Bloomberg, The Wall Street Journal, The Daily Shot – 9/26/17
Sources: The Wall Street Journal, The Daily Shot – 10/23/17

Sources: The Federal Reserve St Louis, The Wall Street Journal, The Daily Shot – 7/28/17

Sources: The Federal Reserve St Louis, The Wall Street Journal, The Daily Shot – 7/28/17

Sources: US Census Bureau, John Burns Consulting, The Wall Street Journal, The Daily Shot – 10/16/17
Healthcare
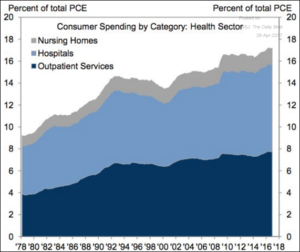
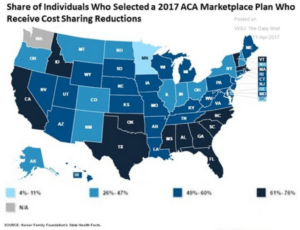
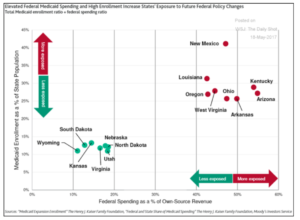
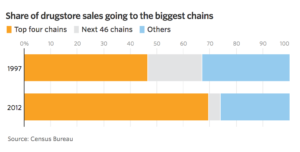
Patients Pay Too Much For Healthcare, Now In Jeopardy: Healthcare costs are over one fifth of our economy – yet compared to other developed countries we pay much more without seeing an increase in life expectancy. Nursing home, hospital and outpatient services are 17 % of PCE (personal consumption expenditure) today, versus 9 % in 1978. The top four drugstore chains now control 70 % of the market – giving them great pricing power with their partners the insurers. Drug companies jacked up prices prior to the election in case Hillary Clinton won, now they are down on average but still 5 times the core inflation rate! Just ask for a price breakdown for a medication, the patient receives an opaque answer of what the insurer pays, the drugstore and the patient. Obamacare has brought health insurance and access to health services to an additional 20 million people now covered since the Affordable Care Act (ACA) was passed. GOP ‘repeal and replace’ proposals would cut coverage to over 24 million people over the next 10 years. A number of states are exposed to Medicaid cuts particularly, inland states like West Virginia, Ohio, Arkansas, New Mexico and Louisiana. Sixty percent of all Americans want the government to ensure that everyone has healthcare coverage. Costs under the ACA have dropped as physician services prices have stopped increasing at all over the last year.
Policy: Experts estimate that by going to a single payer system costs for the total system could be reduced by 10 – 20 % by taking these distribution channels out of the payment process which duplicates the work Medicare already does for 60 million Americans. Drug companies should be banned from advertising prescription drugs directly to consumers – saving $6.4 billion spent in 2016 on direct to consumer advertising. Drug firms are some of the largest corporations to employ stock buyback techniques to juice the price of their stock manipulating its price and causing fraudulent earnings reports. Stock repurchases manipulate the stock price (to drive up price); they do not reduce costs, innovate new services, or compensate employees. Ending stock buybacks by drug and insurance companies would save consumers and government billions of dollars. Aetna spent $1 billion in stock buybacks in 2014 and approximately $750 million in 2015. Anthem has authorized $4.7 billion dollars in stock buybacks in 2016! In 2014, Humana repurchased $500 million in stock driving the price up by one cent over their earnings target of $7.50 per share entitling CEO Bruce Broussard to a $1.68 million bonus. Obama administration deputies, Deparle and Schiliro, recommend to fix Obamacare problems: 1) continue to fund subsidies to states to increase the number of region alternatives 2) maximize enrollment efforts bringing more well people into the system, finalize rules to improve affordability and 3) POTUS use his marketing skills to promote the programs to reduce costs and create confidence in the future viability of the healthcare initiative.

Source: National Institute of Health Committee on Population and Life Expectancy – 2014

Source: Pew Research Center – 4/9/17
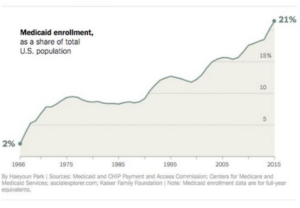
Sources: Medicaid, CHIP Payment and Access System, Centers for Medicare and Medicaid Services, Kaiser Family Foundation – 3/29/17
Source: The Wall Street Journal, The Daily Shot – 4/28/17
Sources: The Kaiser Family Foundation, The Wall Street Journal, The Daily Shot – 4/11/17
Sources: The Kaiser Family Foundation, Moody Investor Services, The Wall Street Journal, The Daily Shot – 5/19/17
Source: Census – 4-27-17

Source: The Wall Street Journal, The Daily Shot – 5/28/17
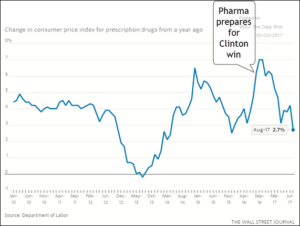
Sources: Department of Labor, The Wall Street Journal, The Daily Shot – 10/2/17
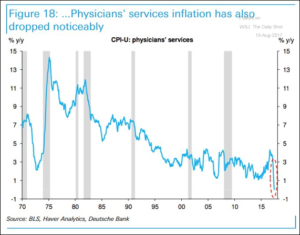
Sources: Bureau of Labor Statistics, Haver Analytics, Deutsche Bank, The Wall Street Journal, The Daily Shot – 8/10/17
Source: Kaiser Family Foundation – 2016
Environment
Carbon Emissions Accelerate Global Warming – Yet There Is a Jobs Opportunity: Over the past 500,000 years the earth has been warming, but in the last 40 years it has been accelerating at unprecedented rates. Recently, a ice sheet the size of Delaware broke off from the mainland of Antartica. Progress is being made by China, Europe and the US bringing CO2 emissions down by 30 %. Yet, this effort has not been enough to counter the growing levels of warmth seen by recent studies. For example, 2016 had the highest average global temperature on record. Ninety percent of the scientific community is convinced that man made industrial carbon gases are the primary cause of this fast increasing warming of our atmosphere. Most countries are concerned with drought conditions versus flooding. In the western US there was a 5 year drought just ended by 169 % rainy season last winter. While in Houston Hurricane Harvey delivered a 500 year deluge the size of the state of New Jersey and the number of extreme rainstorms is increasing. Yet climate change can create new economic engines. Jobs in the solar industry have increased 17 times faster than the overall job growth in the US economy to a total solar workforce of 260k in 2016. The solar industry workforce grew by 25 % on an annual basis!
Policy: The State of California took the lead by passing a new bill signed by Gov. Jerry Brown to continue the carbon emissions cap and trade law provisions until 2030. Federal electric car incentives should be extended and solar industry research and development grants need to be increased and funded to provide the basis for theses high growth sectors. State and Federal programs will give the sound base for an industry to be a job engine to the US economy and provide opportunities for exporting products and services.

Source: The Wall Street Journal – The Daily Shot – 7/25/17

Source: The Wall Street Journal – The Daily Shot – 7/27/17

Sources: Pew Research Center, The Daily Shot, The Wall Street Journal – 8/28/17

Sources: The Wall Street Journal, The Daily Shot – 9/18/17
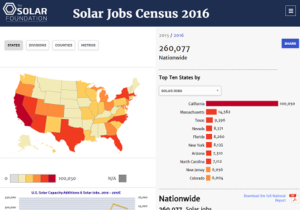
Source: The Solar Foundation – 6/17
Sources: Pew Research Center, The Daily Shot, The Wall Street Journal – 8/28/17
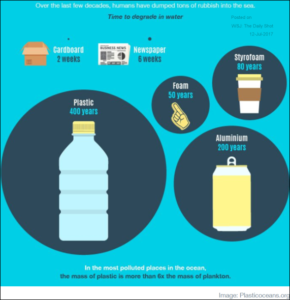
Plastic Is Choking Our Oceans, This Needs To Stop: Scientists recently reported (Feb, 2017, Science) that today plastic is choking our oceans equivalent to 5 grocery bags of plastic and trash per foot of world coastline. This plastic pollutes the water, ensnares wildlife, kills habitat, and hurts the fishing industry. Global plastic production continues to increase with plastic taking over 400 years to degrade versus cardboard at 2 weeks. Why can’t we find another way to store water that is biodegradable?
Policy: Since plastics companies are making profits on their products it would be good to work with them to add a deposit value on plastic bottles as was done with glass bottles so they would have more value and be picked up. State governments can work with companies to jointly fund the deposit. While it is true that may cities have plastic recycling programs they are generally subsidized by local government. Finally, we need to offer incentives and perform more research with industry for a biodegradable solution to end this pollution to our oceans.

Source: Los Angeles Times, The Wall Street Journal – The Daily Shot – 7/24/17
Source: Plasticoceans.com, The Wall Street Journal – The Daily Shot 7/12/17